Capital One Financial poised for a strong 2018

-By Helen Ackerley | [email protected]
Last year, the following estimates were predicted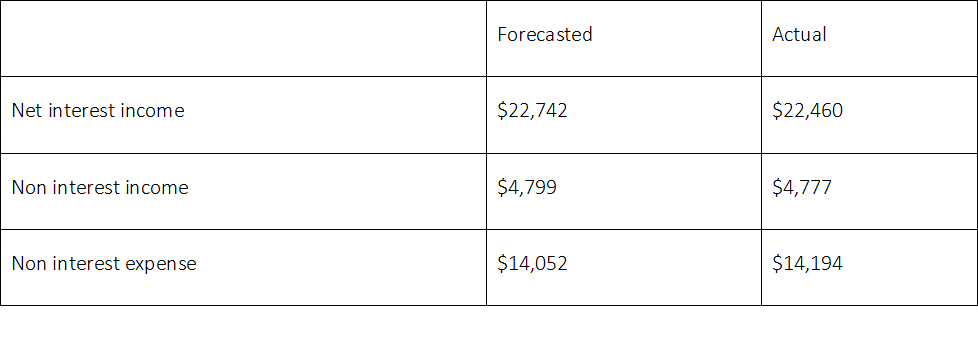
However, provision expense was substantially different than estimated despite the rest of the forecast being near exact. 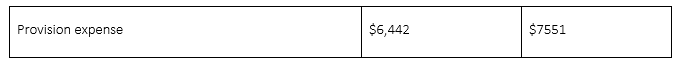
Credit Card Business
Industry: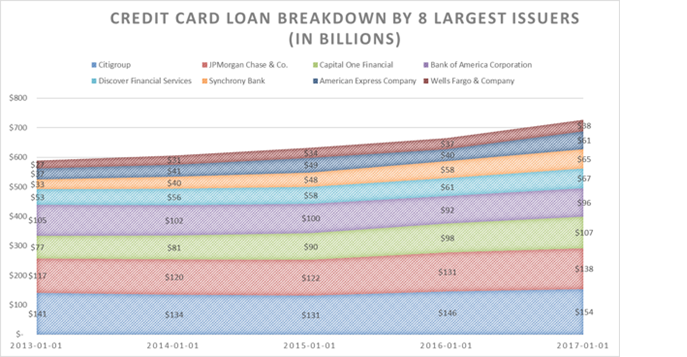
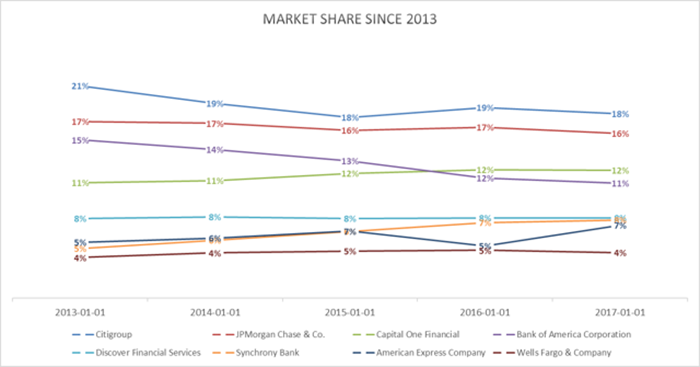
COF, AXP and SYF and WFC have grown their market share since 2013, with AXP and SYF being the most aggressive.
Growth Math
Credit losses were expected to improve in 2017 as “growth math” stabilized. The esoteric term was explained by COF’s founder and CEO, Richard Fairbank who, in 2016, said COF was trying to capture on a growth window and would see elevated charge-offs in 2016, but losses were expected to moderate in 2017. The 2018 model will be cognizant of the factors mentioned above.
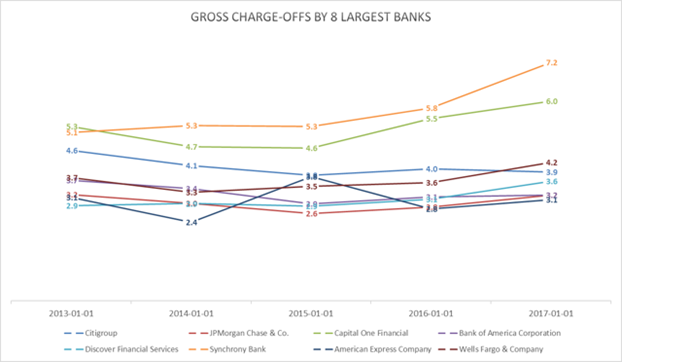
Growth math implies a company has higher charge-offs at first but lower losses after. While high charge-offs are a factor in terms of a bank’s performance, it is not the only criteria in determining the value of a business. COF and SYF have much higher gross charge-offs than the industry but also have much higher yields.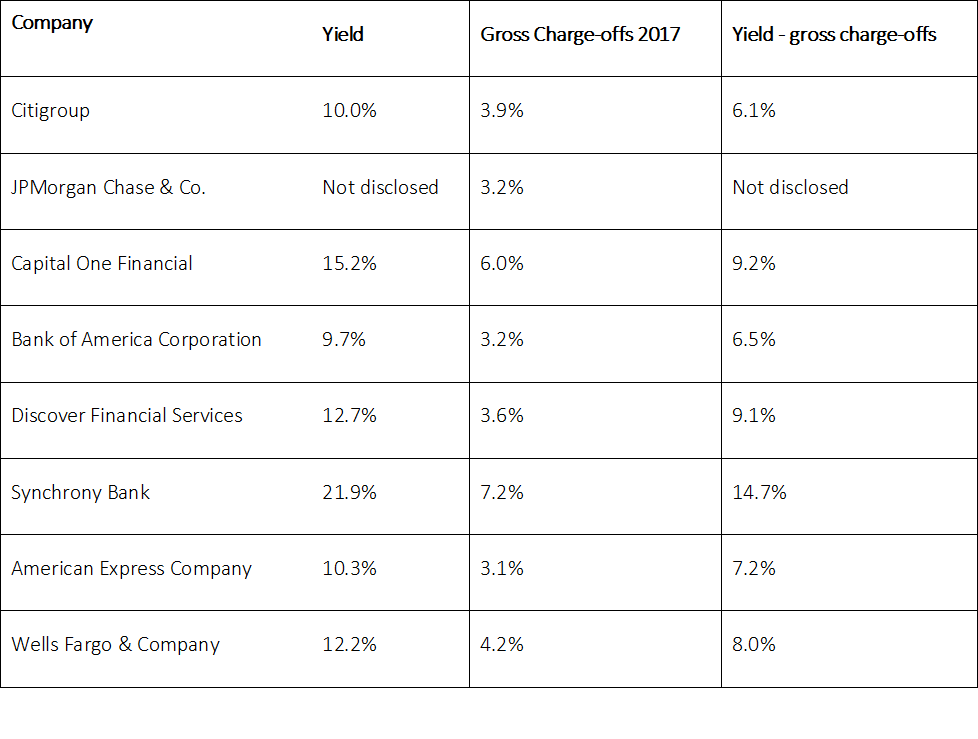 (Source constructed via individual company financial supplements, mentioned above, and BankReg for gross charge-off data)
Growth math can be further elucidated by the following example: when COF finds 10 new customers, 3 might be bad customers, but the 7, good customers, that stay around tend to remain a member of COF for a while. These 7 credit worthy borrowers eventually transition from growth book to the so called "seasoned back book." The unseasoned customers drop off. The seasoned back book produces lower losses because it is made up of the most credit worthy customers. If COF were to slow growth then its book is made up of more credit worthy borrowers and therefore has lower charge-offs.
2017 credit metrics
(Source constructed using: SEC -COF-Monthly Credit Reports)
2017 originally estimated credit metrics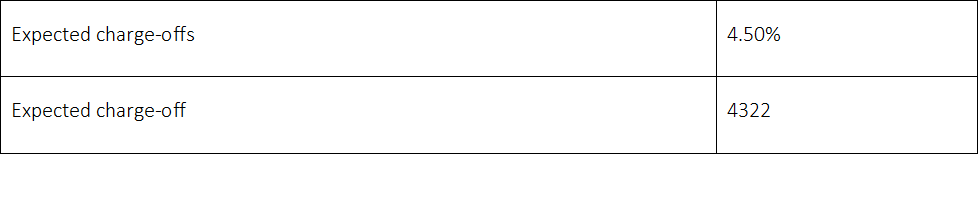 (Source: calculated in early 2017)
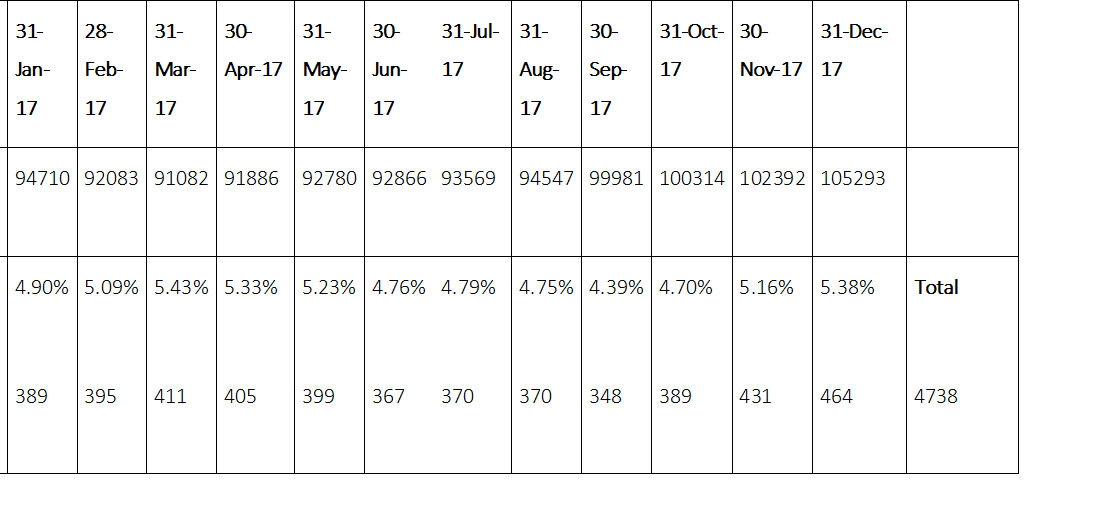 (Source: Actual results constructed using: SEC -COF-Monthly Credit Reports)
Actual domestic charge-offs were $4.738 B in 2017, far above the $4.332B estimated in the beginning of 2017. The company built provisions of $6.1 B for its credit card division in 2017. Charge-offs including its international were $5.054 B (international is around 10% of COF’s Card business). COF said, in its 2016 conference calls, growth math would moderate in 2017, but it accelerated, meaning the company built reserves—charge-offs were $5B but provisions were 6B—a build of $1B. Provisions exceed charge-offs either because a bank is growing loans or it expects higher future loan losses. Since Q2 2013, the company has had provisions/charge-offs on average of 113% (for the entire business not just credit card)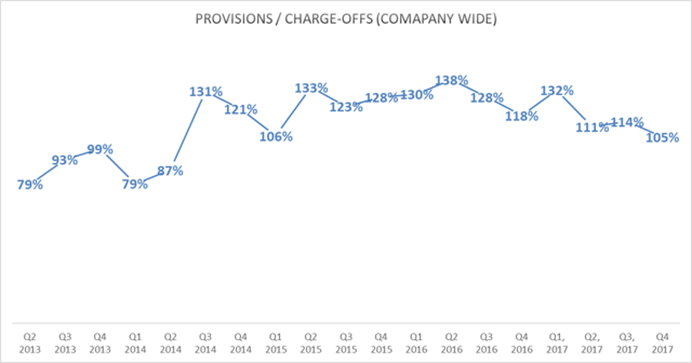 (Source constructed using: company quarterly earnings financial supplement Q3 2013 to Q4, 2017).
Calculation of 2018 credit card loan losses
COF has seen tremendous growth in its credit card division relative to the industry.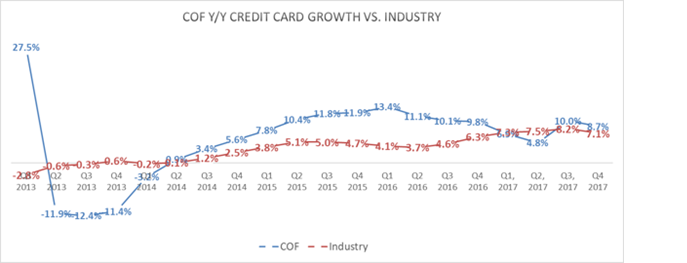
Source constructed using: COF Financials Supplements Capital One - Investor Relations - Quarterly Earnings Releases compared to NY FED industry The Center for Microeconomic Data - FEDERAL RESERVE BANK of NEW YORK
However, COF’s growth slowed at the end of 2018. In fact, some of the growth above included $5.7B of credit card receivables that were purchased from Synovus Bank on September 25, 2017. The complicated transaction in which COF tried to buy Cabela’s, an American direct marketer and specialty retailer of hunting products, only to have the Federal Reserve reject the transaction. Not to be denied, COF came up with a creative solution in which, Synovus Bank, bought the banking assets of Cabelas and then sold the credit card loans to COF. Synovus kept the deposits from Cabela’s and received a $75M fee. Excluding the Cabela transaction, COF, which had typically seen above average trends in terms of growth dipped below the industry in 2017 in terms of credit card loan growth. Fairbank had continually discussed a growth window in 2015 & 2016 and COF elevated its marketing expense substantially. But marketing expense declined to $1.67B in 2017 compared to $1.811B in 2016. The company expects marketing expense to increase in 2018.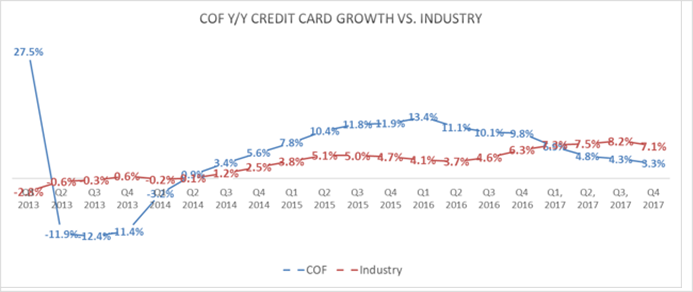
COF’s receivable growth excluding Cabela's
(Source constructed using: COF Financials Supplements Capital One - Investor Relations - Quarterly Earnings Releases compared to NY FED industry The Center for Microeconomic Data - FEDERAL RESERVE BANK of NEW YORK)
The company expects charge-offs to moderate in 2018 as growth math slows. COF's loan growth dipped below industry growth for the entire 2017, it is expected this trend continues—loan growth has been modeled in its credit card division to be half of the of the industry. (Source constructed using: NY Fed loans by type: Loans by Type).
Industry revenue grew by 4.1% in 2017, according to IBISworld.com (Credit Card Issuing in the US) or 57% of loan growth.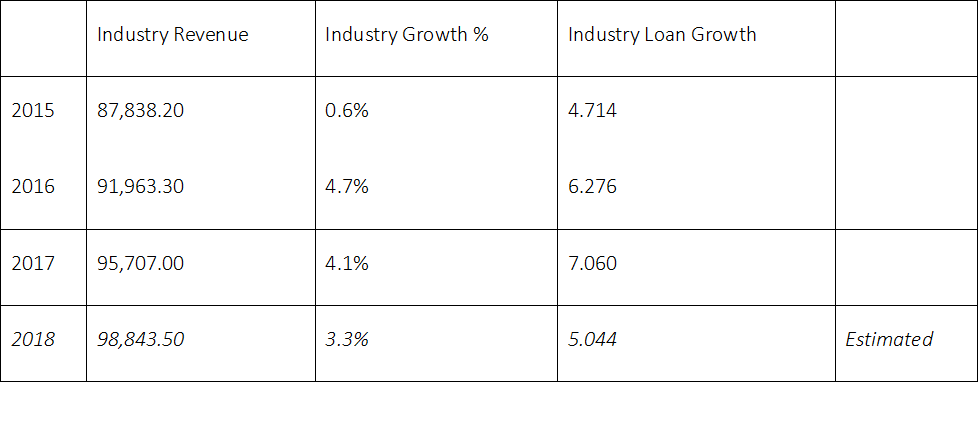 (Source constructed using: IBIS world US INDUSTRY REPORTS (NAICS) > CREDIT CARD ISSUING, and NY Fed loans by type: Loans by Type , 2018 loans estimated internally)
Revenue growth is expected to be 3.3% in 2018 using a similar beta of 57% (revenue growth was 4.1% ÷ 7.1% loan growth) of industry growth that would imply industry loan growth of roughly 5% [3.3% x (7.1 ÷ 4.1)]. It is assumed COF will target loan growth of roughly half the industry like that of 2017 or 3% loan growth.
2012 was used as the starting year for the charge-off calculation as, in this year, COF purchased approximately $28 billion of credit card loans from HSBC. Loans Credit card loans. COF ended 2012 with $92 billion compared to $65 billion the year earlier—today credit card loans today are $115B.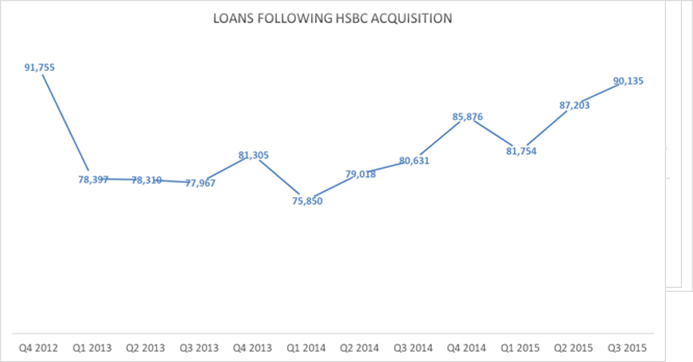 (Source constructed using COF: Financial Supplements)
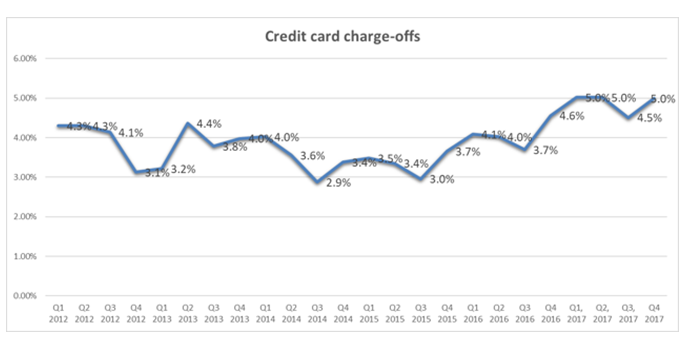 (Source constructed using COF: Financial Supplements)
COF pulled back on growth following the transaction. As the company shrunk its book, it retained its most credit worthy customers. In Q3 2014 and 2015 the company had credit card-charge-offs of around 2.9%. The average charge-offs for its credit card division is 3.93% since Q1 of 2012.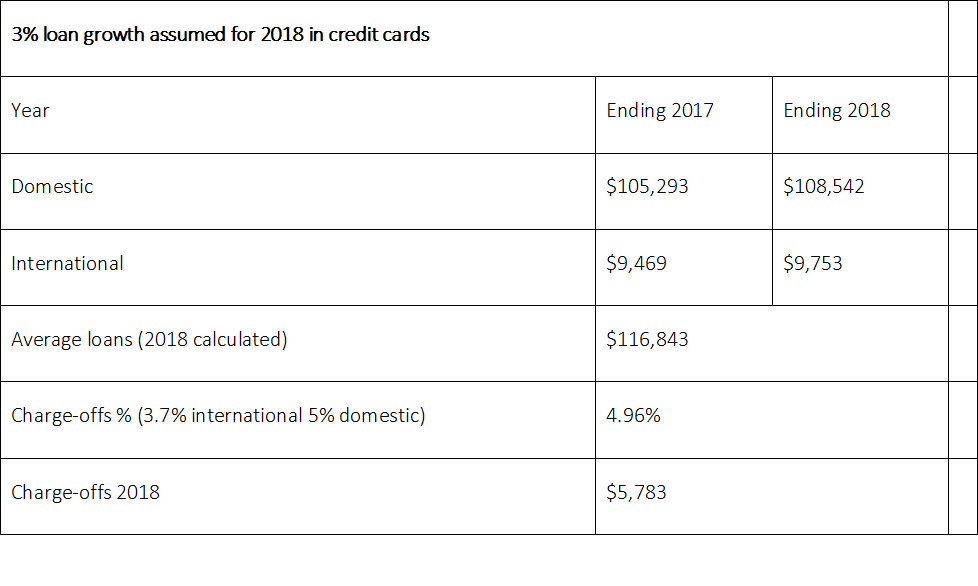 (Source constructed using 3.7% international charge-offs and 5% domestic)
Charge-off rate was 4.88% for credit cards in 2017 and the company's 2017 10-K said it expected upward pressure on charge-offs in 2018 as new loans became a larger part of the book, therefore 5% was estimated.
Estimating 2018 provisions. A primarily forward book business produced charge-offs of 4.88% in 2017 and a primarily back book business produced charge-offs of 3.3% from Q2 2014 to Q3 2015 (average of charge-offs in those quarters). These two figured can be extrapolated to calculate the 2018 provisions, which will be more reliant on the back book by the end of the year.
2018 will still be a mostly forward book business as growth math slows down. The company expects charge-off rates to stay around 5% in 2018. This would imply $5,783 of credit-card charge-offs in 2018. However, as the book matures, a downward pressure on the charge-off rate would be expected a downward rate put on charge-offs. An example is provided below.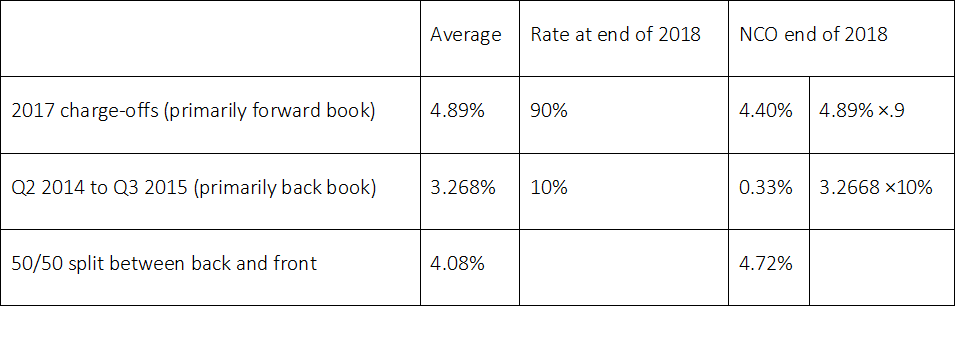 (Source constructed using COF Q3 to 2017 financial supplements and internal calculations)
If the back and book were split evenly then a 4.08% charge-off rate could be expected in 2018. A 90/10 split would produce a charge-off rate of 4.72%. These figures can be used to calculate the company’s reserve release / build for 2018.
For simplicity, it is assumed that the company has linear loan growth throughout 2018.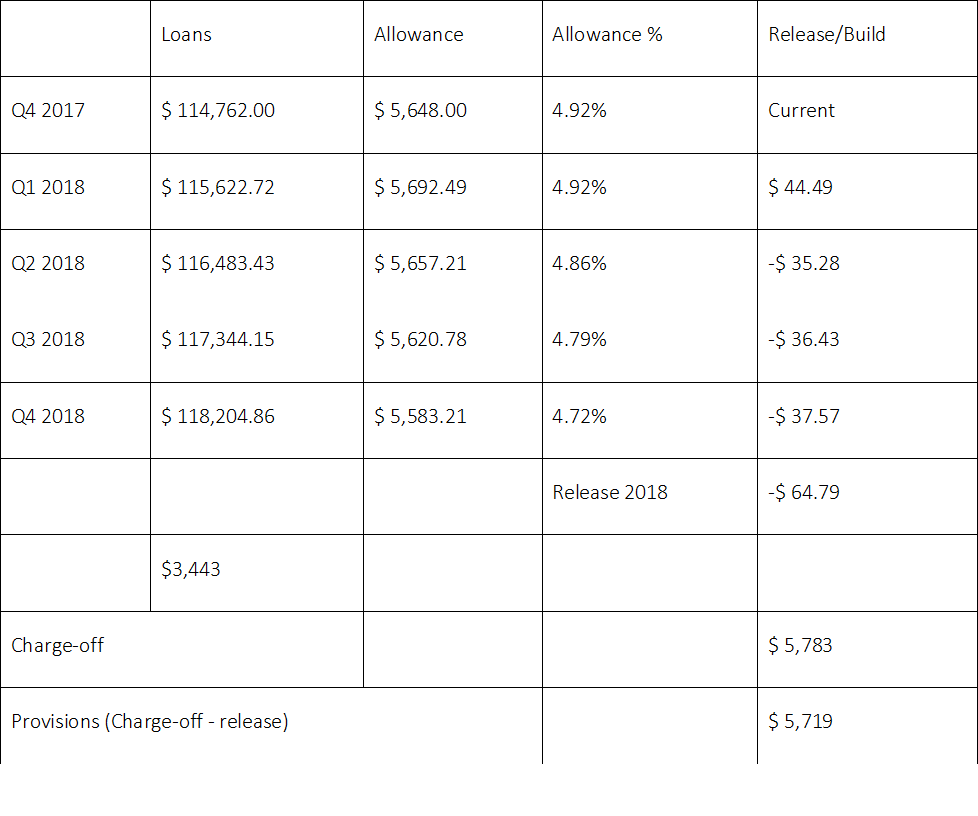 (Source: internal calculations)
Since the book of business should have a charge-off rate of 4.72% at the end of 2018, it is expected the company has a small allowance release in 2017.
Auto Business part of Consumer Banking
Industry: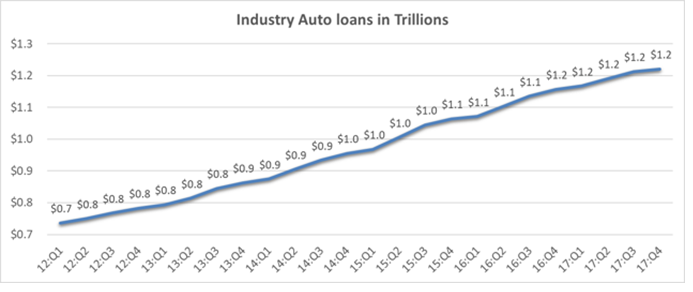 (Source constructed using NY Fed loans by type: Total Household Debt Increases, Delinquency Rates of Several Debt Types Continue Rising - FEDERAL RESERVE BANK of NEW YORK).
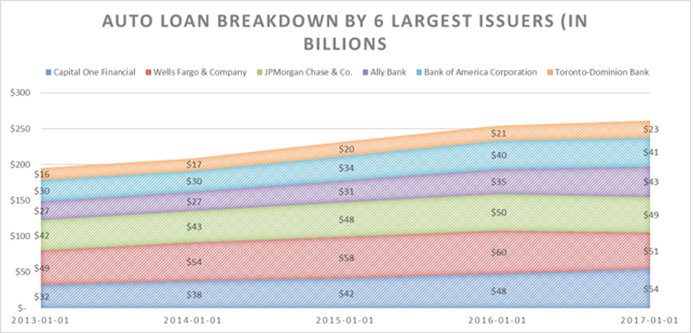 (Source: Constructed through auto loan data from Bank Reg)
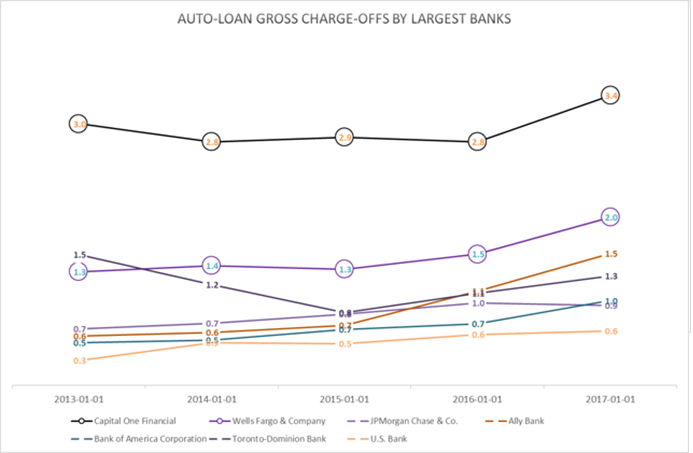 (Source: Constructed through data from Bank Reg — please note that if a loan isn’t through an FDIC registered bank then the loan isn’t included on Bank Reg data—therefore the auto industry is substantially larger than what is owned by the banks since many non- banks hold auto loans. Information is processed by Bank Reg Data from FFIEC Examination Council)
According to Bankreg, which just extrapolates FDIC reports, Capital One Financial is the largest issuer of auto-loans, but Allly Financial holds some of its auto assets outside its FDIC insured bank. For instance, Allly had FDIC banking assets of $137.4 billion in Q4 of 2017 but had $167B of total assets. Ally has $68 billion of consumer auto loans, $37 billion of commercial and another $9 billion of operating leases. Wells Fargo pulled substantially back in its auto loan division in 2017, reducing loans by around $10 billion.
Calculation of 2018 Auto loan losses
In its 2017 10-K COF said it expects growth to moderate in the auto, but Fairbank said in the 2017 Q4 conference call that “I think the growth opportunity is still pretty good in the auto business. COF is expecting charge-offs to increase in its auto loan business going forward.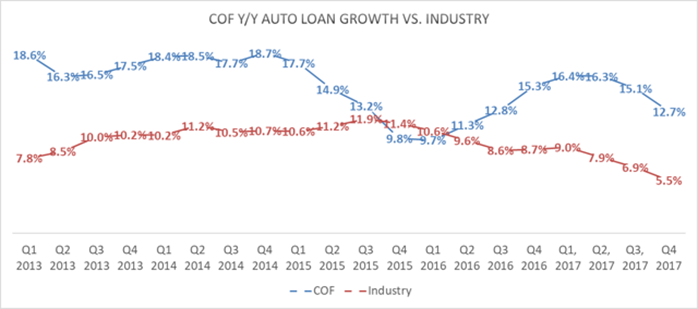 (Source constructed using: COF Financials Supplements Capital One - Investor Relations - Quarterly Earnings Releases compared to NY FED industry The Center for Microeconomic Data - FEDERAL RESERVE BANK of NEW YORK)
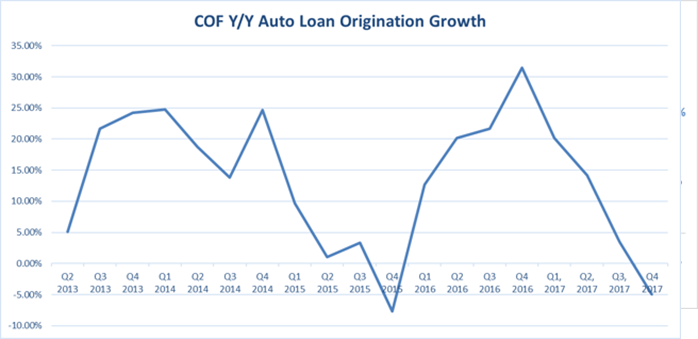 (Source constructed using: COF Financials Supplements)
Industry loans grew 5.5% in 2017. It is estimated that COF will grow its originations by 8% next year compared to the prior year and be only a little above industry growth, this will translate into $29.3B of originations compared to $27.7 B last year. On average the company has seen around 46.3% of its beginning loans paid back by the end of the year (calculation shown below)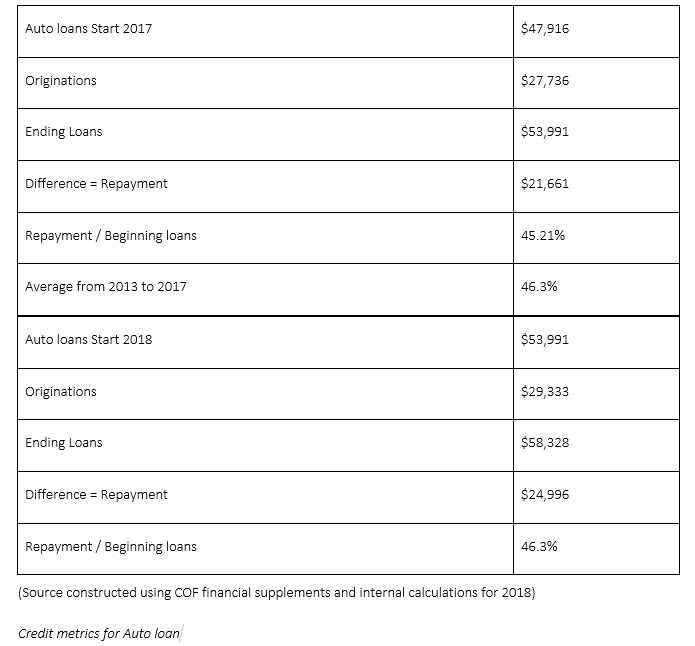
 (Source constructed using SEC-COF-Monthly Credit Reports—Expected charge-off calculation computed)
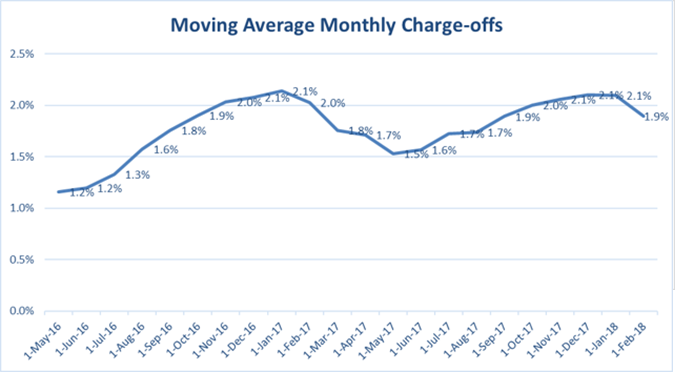 (Source constructed using Monthly Credit Reports)
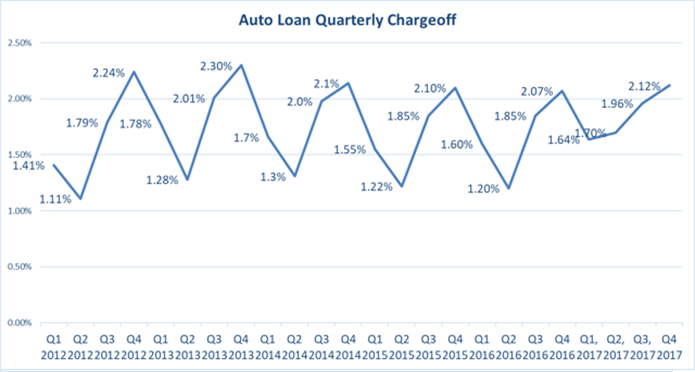 (Source constructed using: financial supplements)
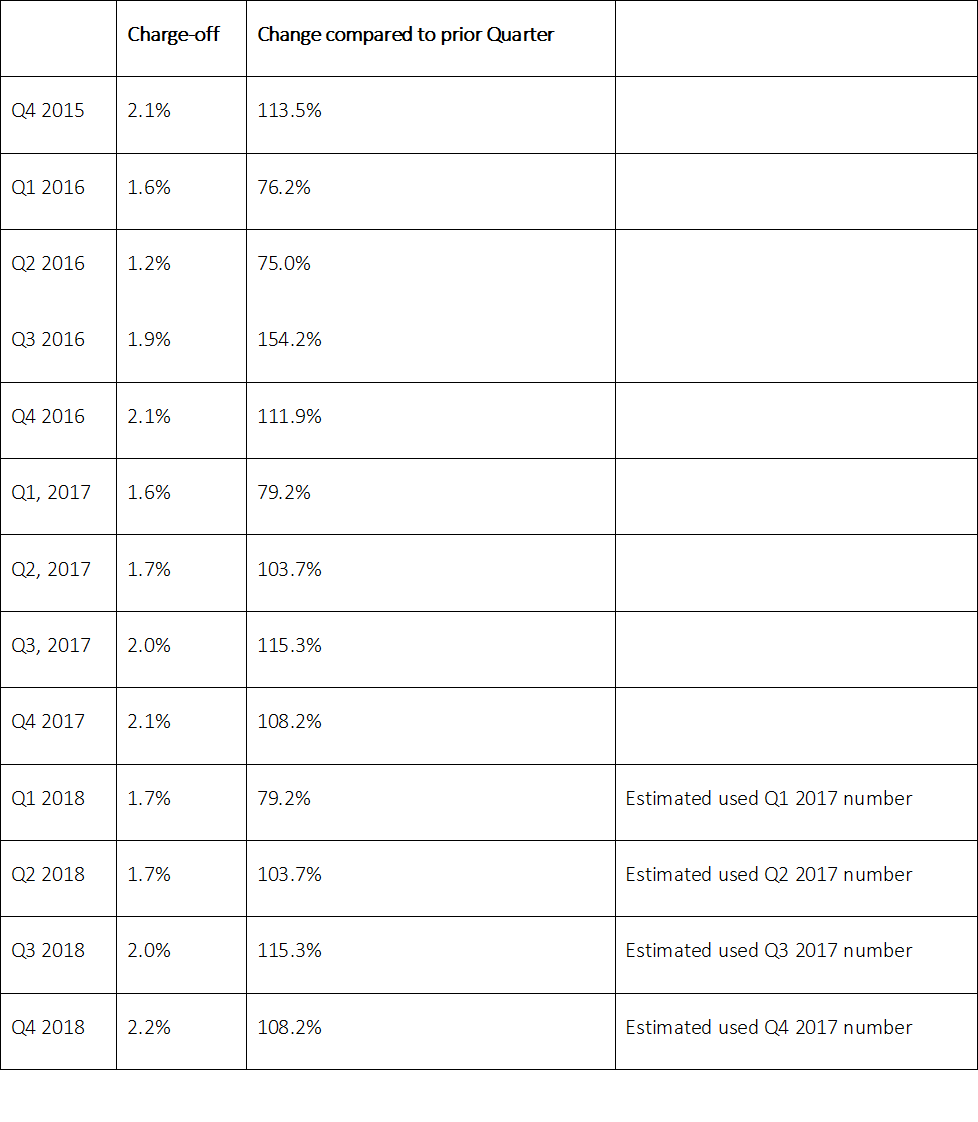 (Source constructed using: financial supplements and internal calculations)
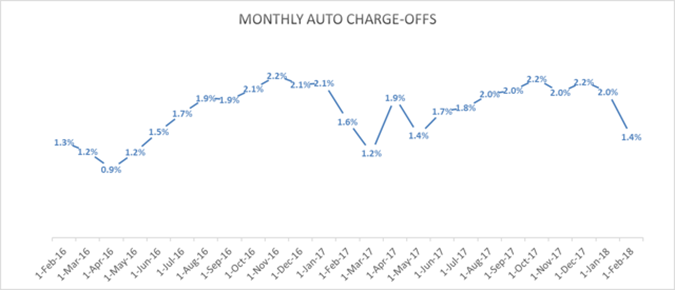
As can be seen above COF did not have as severe a dip in its Q1 2017 charge-offs as it has had in prior years—charge-offs dropped to 1.7% in Q1 compared to 1.2% in 2017. Because the company said auto loan charge-offs would grow, the model assumes that the future rate of charge-offs would be based as a percent of the prior month. Q1 2017 saw charge-offs to be 79.2% of Q4 2016 charge-offs. This number was then applied to Q1 2018. Q4 2017 charge-offs multiplied by 79.2% is an estimated chargeoff of 1.7% for Q1 2018. This produced 2018-charge-offs of 1.9% compared to 1.86% in 2016.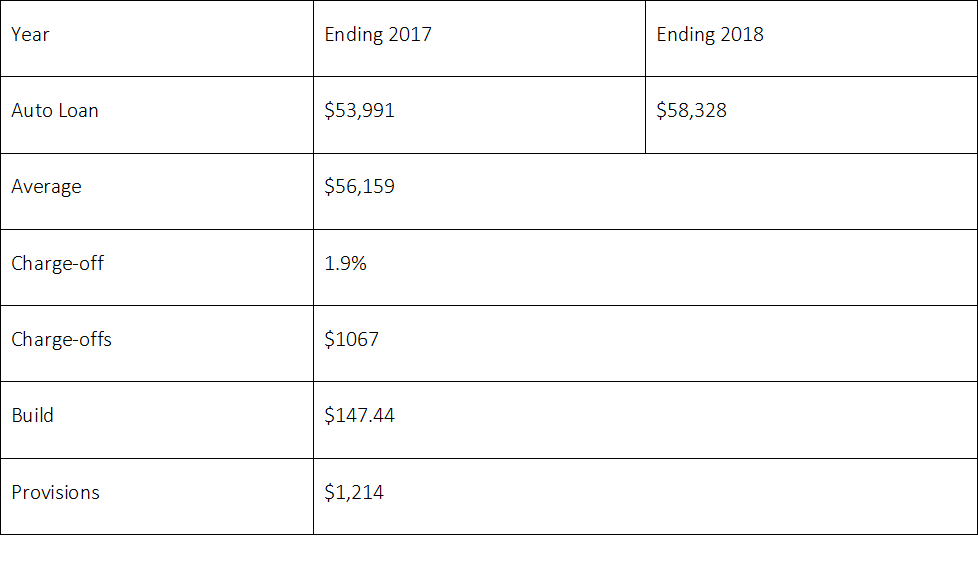 (Source constructed using: financial supplements and internal calculations)
The allowance at the end of Q4 2017 was essentially the charge-off rate for Q4. Allowance was 2.07% of loans compared to 2.12% of charge-offs. Q4 2018 allowance is assumed to equal its charge-off percentage of 2.17%. These assumptions lead to a build in this division of $143 M. 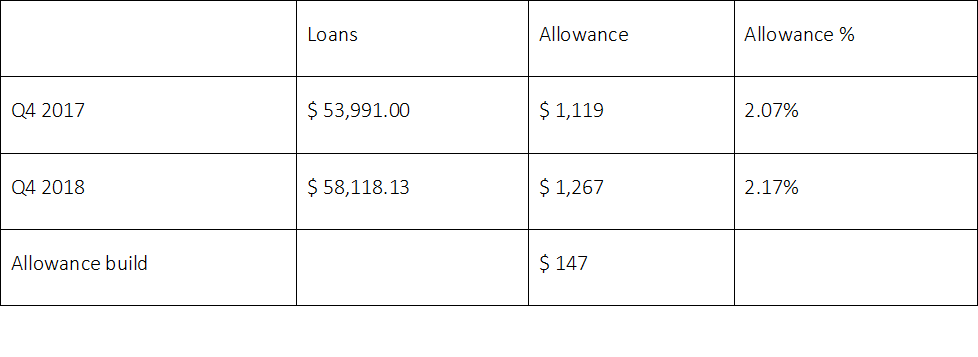
The rest of the consumer loan division has been decreasing in a linear fashion since Q1, 2012.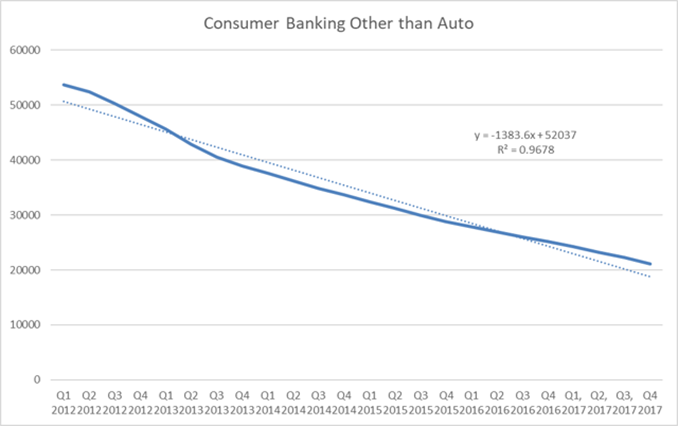 (Source constructed through data from COF Financial Supplements)
This relationship produces ending loans of $15.5 B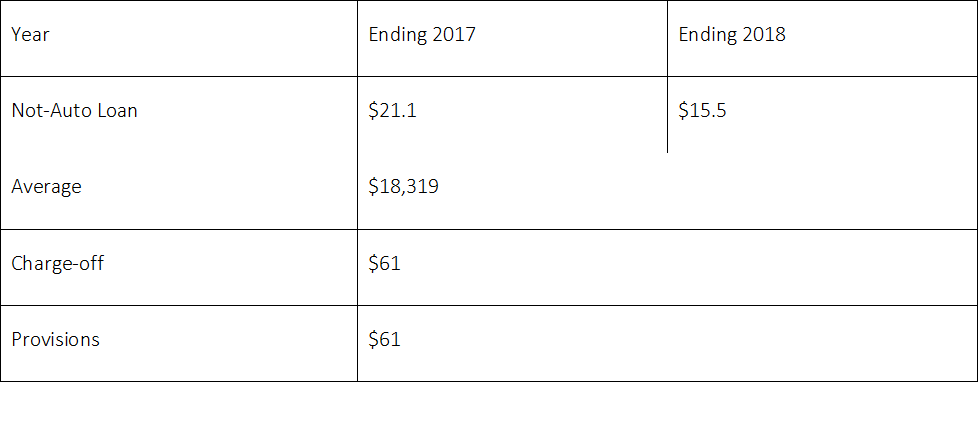 (Constructed using regression formula—each quarter loans drop by $1.383.6 B)
Last year provisions were $61M, for simplicity, the number for 2018 is expected to match this number.
Commercial Division
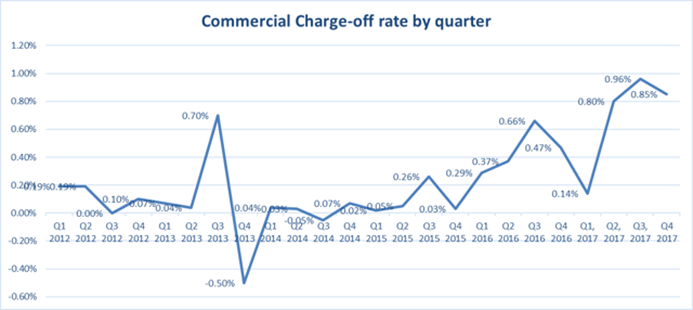
COF is not expecting much growth, if any, in its commercial side because of competition caused from non-bank lenders. The company had substantially elevated provision expense in the last several quarters due to high taxi medallion loan losses. Even though the taxi medallion portfolio only made up $390 M of loans in Q3, the company recorded a provision expense of $115M related to this individual portfolio in Q4 2017. The company should see further releases as $2.5B of loans are in the Oil & Gas industry, and the price of oil has increased substantially in Q1 2018.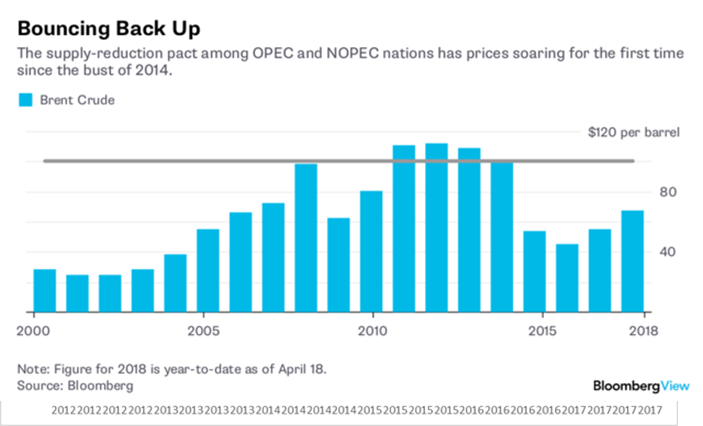
 (Source constructed using: financial supplements)
The company had 1.13% for an allowance against these loans at the end of 2017. This number is too high given the historically low charge-off rates. The last 12 quarter average charge-off is .57%. Furthermore, the increase from the .45% charge-offs in 2016 to .69% in 2017 was essentially all related to the taxi portfolio, which is now gone. If the company pares back its allowance to .9% then losses would be the following.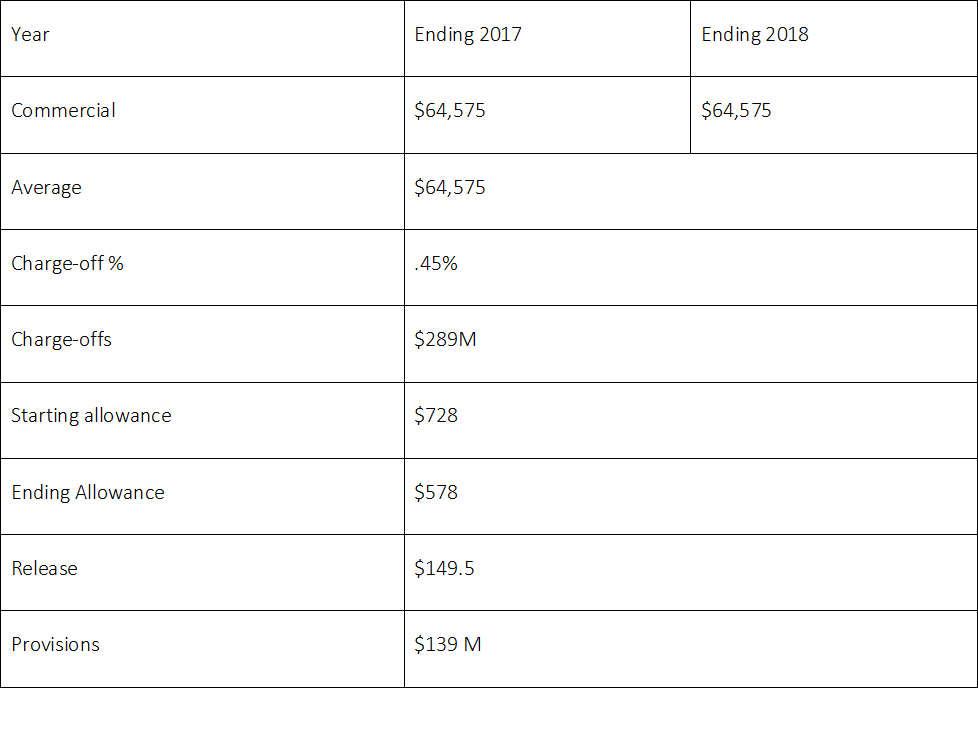
Summary: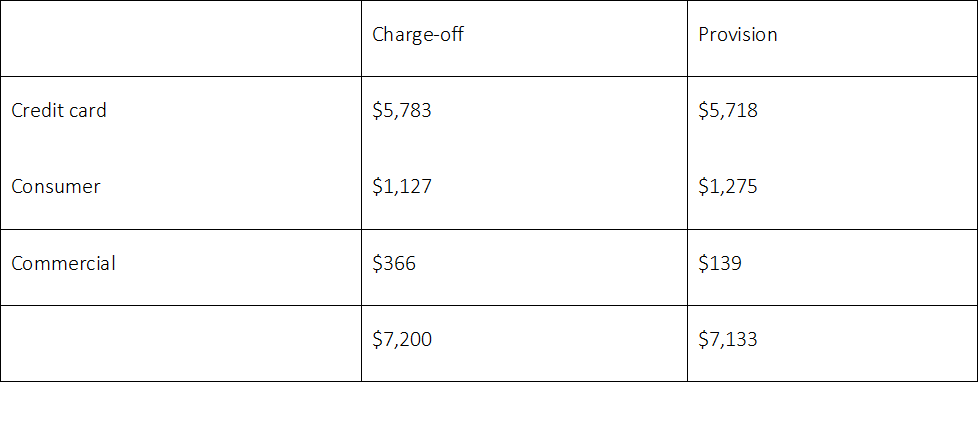
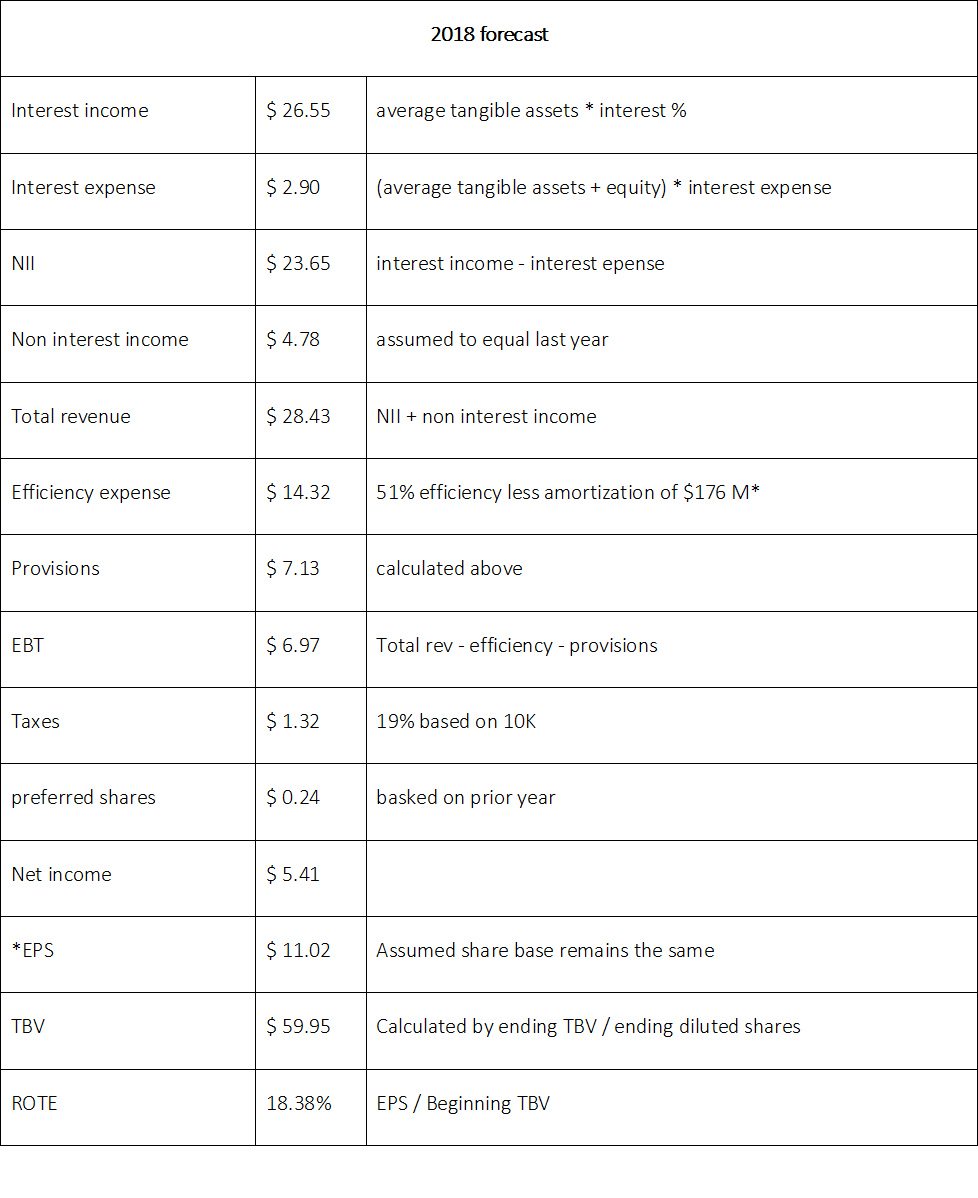
Net Income 2018 Calculation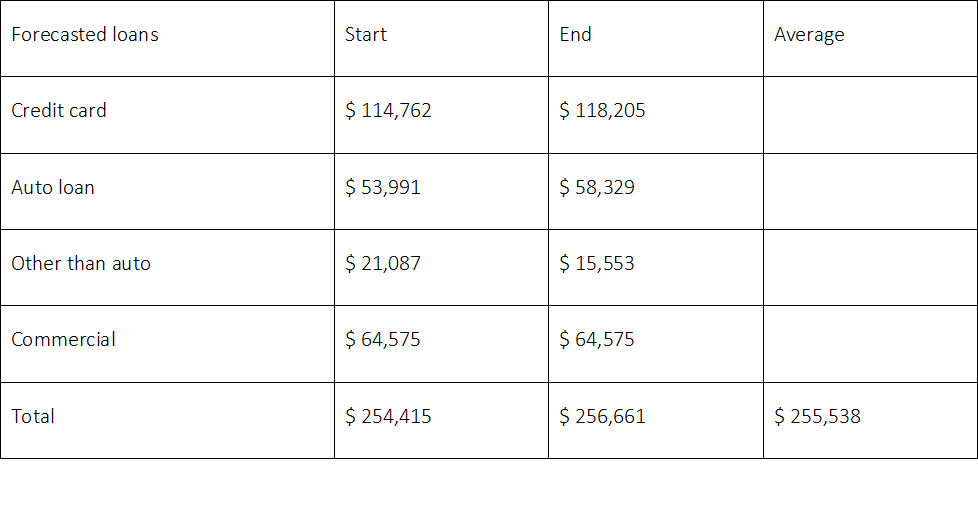
2018 Net income calculation
The company earned 7.49% on its average tangible assets last year ($25,312 B of interest income / average tangible assets). The company paid on average .82% for its equity and liabilities. (Interest expense / average liabilities + equity)
Efficiency Ratio
The company’s adjusted efficiency ratio was 51.02% in 2017. The company expects to see modest efficiency gains in 2017. COF includes amortization expense in its efficiency ratio however this expense does not affect earnings power. The depreciation of intangibles is similar to how goodwill used to be depreciated in the early 2000’s. Most intangibles are not losing value year to year. For instance, COF had $2.1B of book value purchased credit card relationships (PCCR) and a net book value left of $436 M. There is no indication from the company is losing these relationships in a linear fashion. If anything, the company has enhanced its relationship with these customers and could write up the value. However, accounting convention says you can write down intangible assets but never write them up. Clearly these rules make no sense. Accounting should reflect the substance of a company and by allowing write-downs but not writeups the charge just becomes a wrong number. Furthermore, as mentioned, it would be better if this was never capitalized in the first place.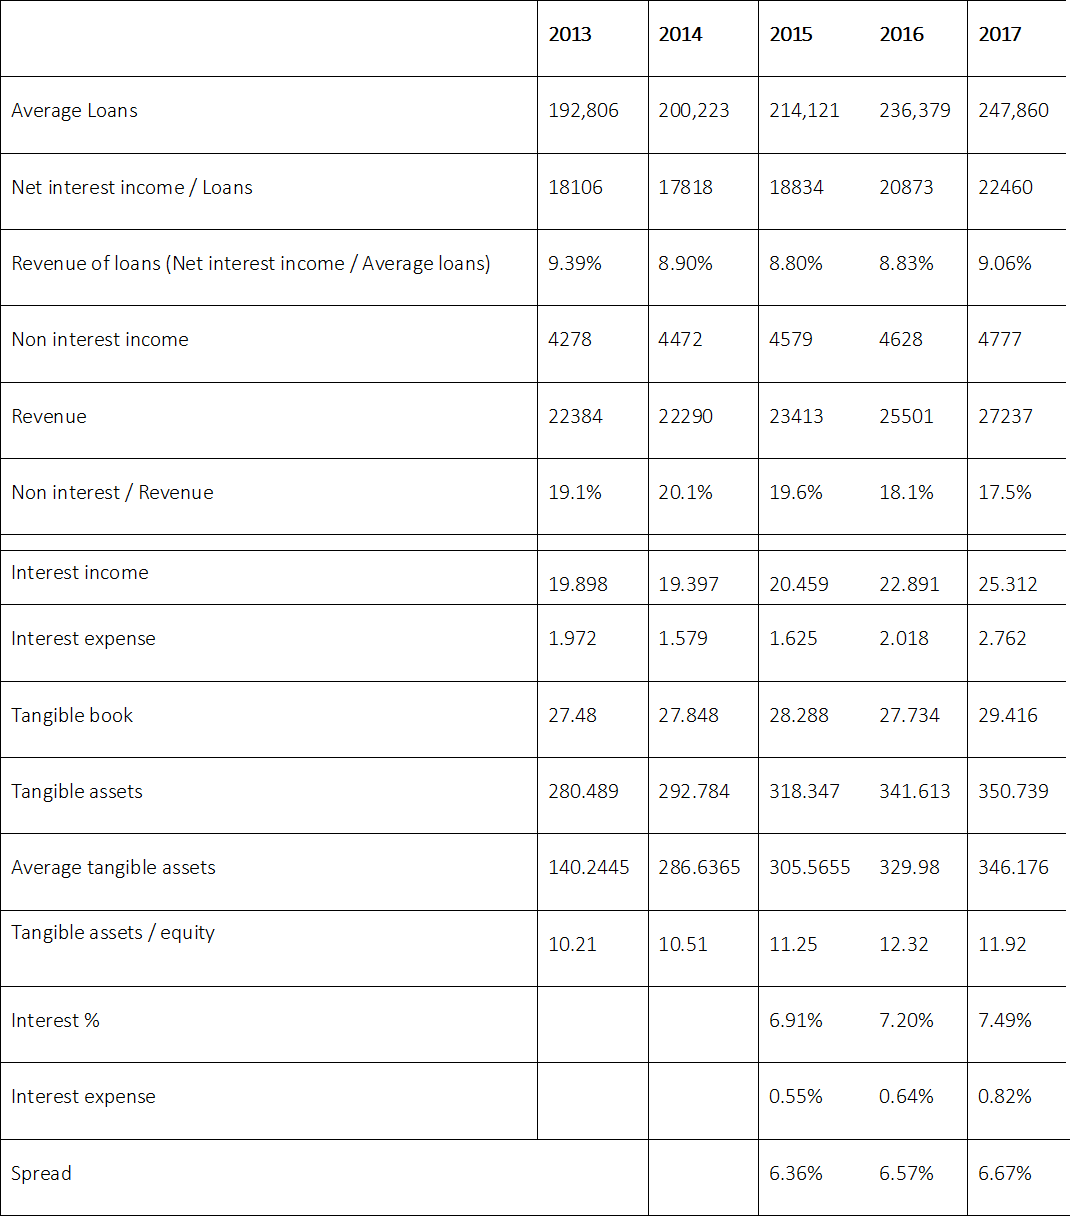
Given its expected strong EPS expansion COF appears to be substantially undervalued.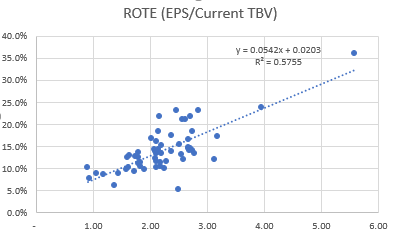
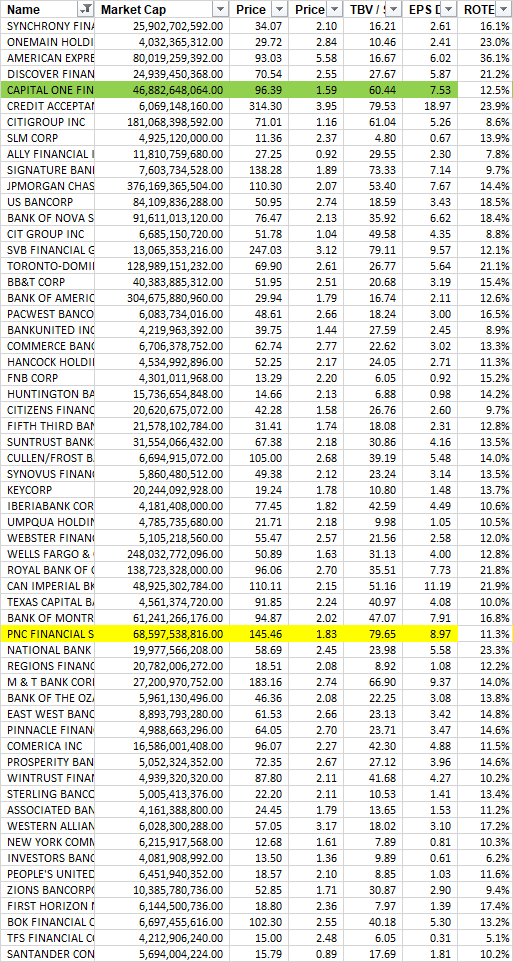 Plugging Y of 18.3% and solving for X for COF into the formula we would get an expected price to tangible book value for COF of 3, implying a price of approximately $180--therefore investors should expect substantial upside.
Please check with your financial advisor before making any investment decisions. Disclaimer: Do not base any investment decision upon any materials found in our stock reports. We are not registered as a securities broker-dealer or an investment adviser either with the U.S. Securities and Exchange Commission (the "SEC") or with any state securities regulatory authority. We are neither licensed nor qualified to provide investment advice. The information contained in our report is not an offer to buy or sell securities. We distribute this information exclusively to individuals who wish to receive it.