Are Low Volatility Portfolios The Future?

-By Sam B | [email protected]
SPLV is a low volatility portfolio that is constructed with the 100 least volatile stocks in the S&P 500 over the past year. Volatility is calculated using the standard deviation of percentage price moves of a company's stock. For instance, a quick example of how volatility is calculated can be seen here. 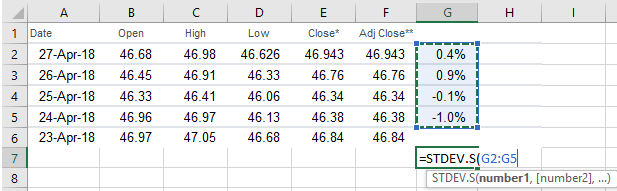 Low volatility can be measured using daily prices, monthly price changes or even yearly—though the issue with using yearly prices is that there isn't a lot of data. Once SPLV sorts its 100 lowest volatility or standard deviation. SPLV run by Invesco, chooses 1% in each stock that gets rebalanced quarterly.
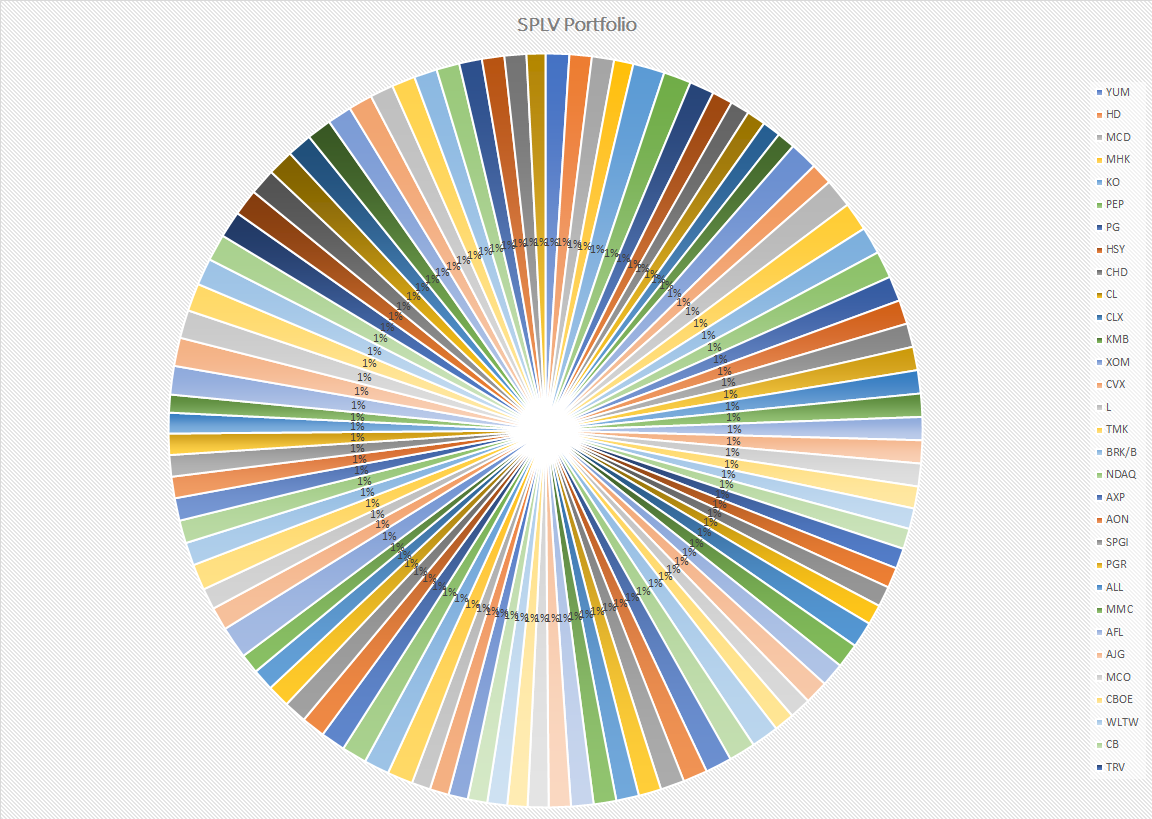
As can be seen, each stock is approximately 1%. The reason for going above 1% or below would be based on how the stock moves in the quarter. While achieving similar returns to the S&P 500, the low volatility index has mitigated losses in down periods, which should help investors feel more comfortable. Investors often panic when investments go down such as in the great recession of 2008. 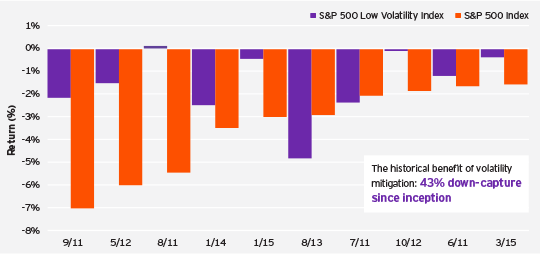 While it may be a positive to invest in low volatility, is SPLV's strategy advanced?
The answer is NO! SPLV uses a simple formula of standard deviation then chooses weightings for its investments. SPLV's current primitive strategy has around $7 billion of assets under management. A better low volatility has been built by us and backtested by the Market Is Open to see its results compared to the market.
Step 1: we used the lowest 100 volatile stocks of the S&P 500 based on low volatility based on the previous 24 months. This is similar to what SPLV did—though 24 months is a little more data.
Possible improvements?: I have yet to backtest this, but what if the entire 8000 or so stocks that are listed in the U.S were sorted by something like credit rating as a proxy for risk (or even more stocks could be used using all global stocks). Or using profitability metrics might be a better proxy for low risk. There are quantitative metrics that are likely a better indicator of company stability than standard deviation. The fact is the way a stock moves isn't the best measure of risk. However, our current model keeps with the industry norm.
Step 2: Instead of allocating 1% to each stock like SPLV did; we built a correlation matrix that measured how each stock moves against each other. For example, if one stock moved 1% and the other moved -1% on every single day then their correlations would be -100%. If it was completely random then the correlations would be 0%. A 0% correlation or low correlation has interesting properties. It is an interesting intellectual exercise to elucidate the point.
Question? If you had the following two investments: says
STOCK 1 is 20% undervalued risk of 10%
STOCK 2 is 25% undervalued % and risk of 6%.
Say the correlation between the two investments is 0%
Answer:
a) buy all of stock 1
b) buy all of stock 2
c) Mix the 2
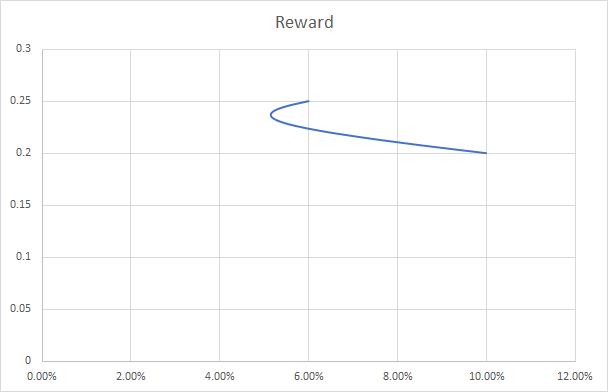
The correct answer is c even though "B" seems superior in every imaginable way. Somewhat counter intuitively an investor can actually improve his reward to risk ratio (Return / Risk) by buying some part of the riskier stock. The reason is the low correlation between the investments means that if the 6% risk is fully activated in one the low correlation means its very unlikely to be activated in the other.
Example Let's say there was a 6% chance the Cleveland Cavaliers would lose to the Indiana Pacers and there was a 10% chance the Raptors would lose to the Washington Wizards and the 2 series are entirely unrelated (0% correlation). If you bet all your money on Cleveland you would have a 6% chance of losing it all. If you bet 100% on Toronto you would have a 10% chance to lose it all. But if you split the investment, you could lower your risk. In this example the best mix is approximately 80% Stock 2 and 20% Stock 1. As you can see you lower your risk to around 5% but the rewards dips by less hence a higher reward to risk.
 The formula to calculate a 2 stock portfolio is rather simple and if interested one can read the information from this source (calculation). However this approach can be used to calculate a near infinite amount of stocks if you have enough computing power. Here is an example of the covariance matrix that we calculated for the 100 lowest volatile S&P 500 stocks.
 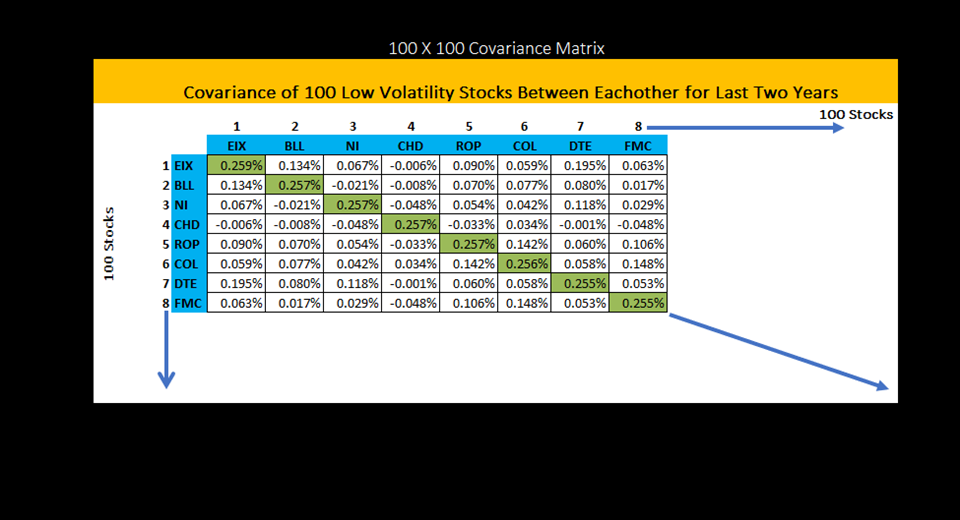 Obviously this can be done for even more stocks. And overseas stocks as well!
Possible improvements? While correlation based on how stocks move everyday was the basis for what was done above. Because how stocks move isn't always the best measure of risk. For instance a stock like U.S. steel may move up with the general market but the market for steel could be poor. Using correlation based on sector profitability by year might be the better way to measure correlations in the long run but this has not yet been backtested.
Step 3: Once all the correlations are figured out, you would solve for the portfolio that gives you the highest expected return for the lowest risk. The portfolio that we built delivered staggering results since 2007. The portfolio was rebalanced every year from 2007 to 2017. 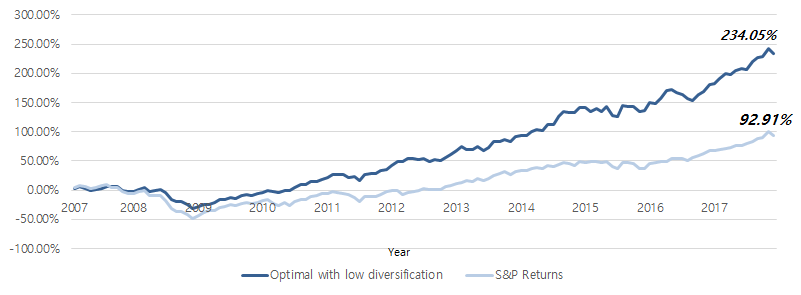
Our portfolio weightings based on correlation of risk and returns delivered this backtested portfolio to start 2007. 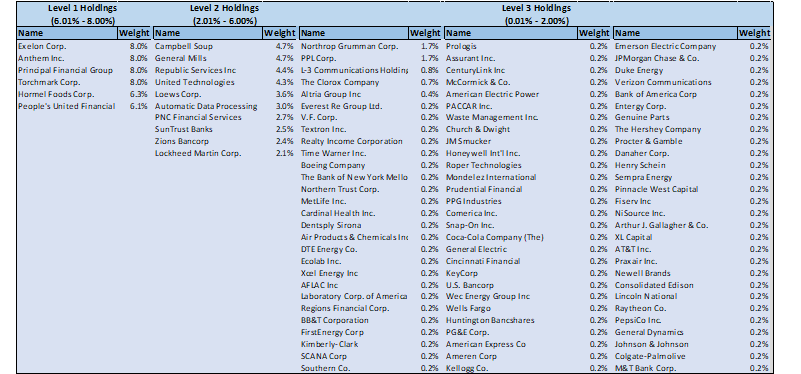 As can be seen, it could more efficient to not do 1% in each stock (that SPLV did) but to weight it based on more advanced quantitative criteria.
Possible improvements? Our portfolio set 8% as the high and .2% as the low weighting for each stock. Unfortunately solver programs based on past data will often put all their money into few stocks, which could potentially be very risky. 8% and .2% were arbitrary numbers that we used as a max and a min weighting. We are unsure yet how to think of the optimal maximum and minimum amounts to put in each stock. Obviously, over time, it could be tested empirically but further research has to be done on a max and min weighting of an asset class.
Conclusion:
In conclusion, low volatility can reduce risk and maybe even increase returns. The question is, is their a smarter way to build the portfolio? Right now, low volatility portfolios are quite dumb—such as SPLV—and there is huge room for improvement. Some of the ideas presented above are possible ways to further improve low vol ideas. But the research is merely off to a positive start on low volatility, a complete conclusion is not yet known. 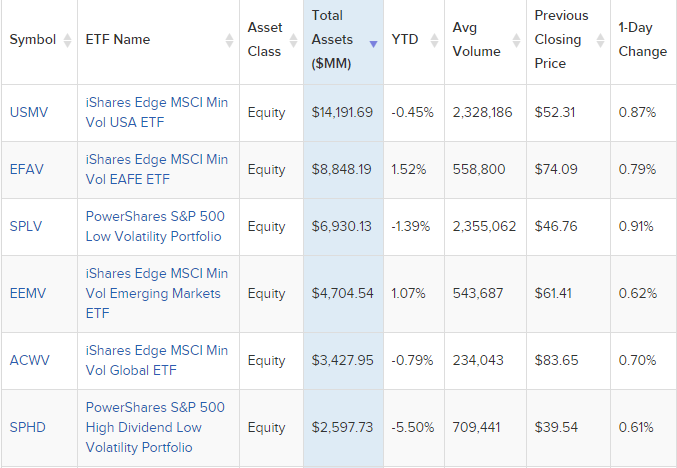 largest low volatility ETFs